HTTP Items
In modern environments, monitoring stops being useful the moment you only check whether a port is open. Applications, platforms, and integrations increasingly communicate over HTTP-based APIs, and if you want to understand whether something is actually working, you need to monitor it at that level.
The HTTP agent item allows Zabbix to act as a native HTTP client. It can send HTTP or HTTPS requests, authenticate, include custom headers, send payloads, and process responses as structured monitoring data. This makes it possible to monitor REST APIs, web services, internal microservices, SaaS integrations, and even the Zabbix API itself,without external scripts or custom agents.
At a beginner level, the HTTP agent answers the question “does this endpoint respond?”. At an expert level, it answers “is this application behaving correctly, securely, and predictably under real conditions?”.
With the release of the Zabbix 7.x serie, the HTTP agent has become more efficient and user friendly, featuring realtime configuration validation and improved connection handling.
How the HTTP Agent Item Works
An HTTP agent item is executed by the Zabbix server or a Zabbix proxy. For each execution, Zabbix performs exactly one HTTP request based on the configured parameters and stores a result derived from the response.
Zabbix does not decide whether a response is “good” or “bad”. It records facts: headers and body content. Interpretation is left entirely to preprocessing and triggers. This design makes the HTTP agent item flexible enough to support both simple availability checks and advanced API monitoring.
Internally, Zabbix uses libcurl to perform HTTP and HTTPS requests. This is an important implementation detail. Redirect handling, TLS negotiation, proxy behavior, timeout semantics, and error reporting all follow curl behavior. If a request can be reproduced successfully using the curl command line, it can almost always be made to work in Zabbix with the same parameters.
Efficiency: Persistent and Asynchronous Connections
Since Zabbix 7.0, the HTTP agent supports Persistent Connections. Instead of opening and closing a new TCP connection for every check, Zabbix can keep the connection open. This significantly reduces CPU overhead and network latency, especially when polling high frequency API endpoints.
Also since Zabbix 7.0 HTTP pollers are asynchronous, execution order and timing are not as simple as “one poller, one request”.
An HTTP poller can initiate hundreds of requests, (1000 per poller to be precise) wait for responses, and process completed transactions while other requests are still in flight. This makes HTTP monitoring efficient, but it also means that slow endpoints do not block fast ones, as long as poller capacity is not exhausted.
However, timeouts still matter. A large number of slow or failing endpoints with long timeouts can consume concurrency slots and reduce effective throughput. This is another reason why conservative timeout values and reasonable polling intervals are critical in large environments.
Understanding that HTTP agent items are asynchronous helps explain why increasing poller counts rarely fixes poorly behaving endpoints.
Core Request Configuration
Every HTTP agent item starts with a URL. This must be a fully qualified HTTP or HTTPS endpoint, including the scheme and path. Zabbix sends exactly what you configure; it does not infer protocols or rewrite requests.
The request method defines how the request is sent. GET is the default and works well for most health checks and read only API calls. POST, PUT, PATCH, and DELETE are available and commonly required for REST APIs that expect structured input.
When the chosen method supports it, a request body can be defined. The body is sent verbatim. Zabbix does not validate JSON syntax, escape characters, or infer content types. Any formatting errors are passed directly to the remote endpoint.
To ensure the request is interpreted correctly, HTTP headers can be defined explicitly. This is where authentication tokens, API keys, content types, and vendorspecific headers belong. Headers are static per item, which is intentional and has implications for advanced use cases discussed later.
- Request Method: GET is the default, but POST, PUT, PATCH, and DELETE are available for interactive APIs.
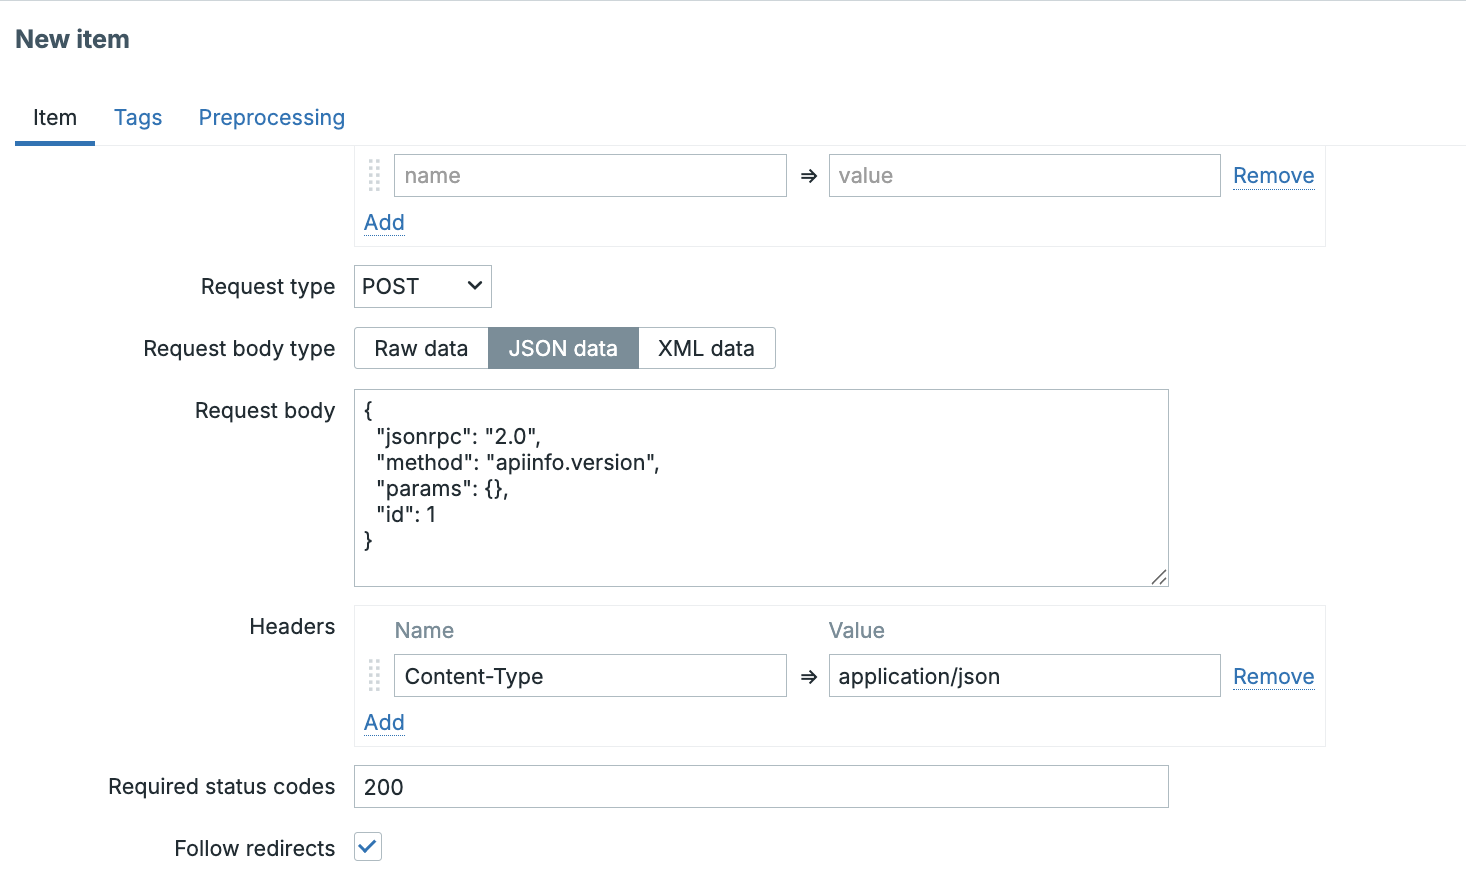
- Request Body: You can define a body for methods like POST. Zabbix has improved the handling of JSON and XML types. When you select these, Zabbix automatically sets the correct Content-Type header (e.g., application/json) if you haven't specified one manually.
Headers: This is where authentication tokens and vendor-specific requirements belong.
Expert Tip : Always use Secret Macros (e.g., {$API.TOKEN}) for headers containing credentials to ensure they are masked in the UI and logs.
HTTPS, Certificates, and Trust
HTTPS support for HTTP agent items depends on the environment in which the Zabbix server or proxy runs. HTTP agent items do not maintain their own certificate store. All TLS validation is performed using the system trust store available to the Zabbix process.
If an endpoint uses an internal or private certificate authority, that CA must be trusted by the operating system running Zabbix. Installing a certificate in a browser does nothing for Zabbix.
Disabling certificate verification at the item level may make errors disappear, but it also disables meaningful security checks, including hostname validation. In production environments, this should be treated as a temporary diagnostic step, not a solution.
For APIs that require mutual TLS, Zabbix supports client certificates. The HTTP agent item references the certificate and private key, but the files themselves must exist on disk and be readable by the Zabbix process. Permission issues here often surface as generic TLS failures, so testing with curl using the same certificate and key is strongly recommended.
Timeouts: What They Really Mean
The timeout parameter of the HTTP agent item is often misunderstood, and the distinction matters in production.
The configured timeout is not a single, shared budget for the entire request. Instead, it is applied to multiple blocking phases of the HTTP transaction, following libcurl behavior.
Conceptually, the timeout applies to:
- DNS resolution
- TCP connection establishment
- TLS handshake (for HTTPS)
- Sending the request
- Waiting for the response
- Receiving the response body
These phases occur sequentially, and each phase can consume up to the configured timeout.
As a result, the total wall clock execution time can exceed the configured timeout. This is why users sometimes observe behavior that looks like “double timeout”.
For example, with a timeout of 10 seconds:
- Connection and TLS negotiation take 9 seconds
- The server then takes 9 seconds to respond
The request may complete after roughly 18 seconds without violating timeout rules.
This is not a bug. It is a consequence of exposing a single timeout value rather than separate connect and read timeouts.
From an expert perspective, this means the timeout should not be treated as a strict SLA boundary. Always leave margin between expected response time and configured timeout, especially for APIs that perform backend processing.
What Becomes the Item Value
The HTTP agent item allows you to choose what part of the HTTP response is stored as the item value.
Zabbix can store the response body, the response headers, or the HTTP status code. This choice has architectural implications.
Storing the full response body allows multiple dependent items to extract different values from a single request. Storing only the status code creates a lightweight availability or correctness check with minimal processing overhead.
At scale, choosing the correct retrieval mode reduces API load, minimizes network traffic, and keeps Zabbix performance predictable.
Preprocessing and Structured Data
Most APIs return structured data, commonly JSON. Preprocessing allows Zabbix to extract specific values using JSONPath expressions, regular expressions, or text transformations.
A common expert pattern is to create one HTTP agent item that retrieves structured data and several dependent items that extract individual metrics. This avoids repeated API calls and ensures consistency between related values.
Preprocessing is performed entirely on the Zabbix side after the request completes and does not affect the request itself.
HTTP Agent Pollers and Server Configuration
HTTP agent items are executed by a dedicated pool of processes called HTTP pollers. These are separate from regular pollers and are configured explicitly in the Zabbix server or proxy configuration file.
The number of HTTP pollers is controlled by the StartHTTPAgentPollers parameter. If this value is set to zero, HTTP agent items will not be executed at all, regardless of how many are configured in the frontend. This is an easy oversight when enabling HTTP monitoring for the first time.
Choosing the correct number of HTTP pollers is not about matching the number of items one-to-one. Since Zabbix 7.0, HTTP pollers are fully asynchronous. A single HTTP poller can manage up to 1000 concurrent HTTP requests internally, using non-blocking I/O.
This is a fundamental architectural change compared to older Zabbix versions and explains why HTTP agent items scale far better than many users expect. Increasing StartHTTPAgentPollers is usually only required when dealing with extreme request volumes, very slow endpoints, or aggressive timeout values.
From an expert perspective, it is often better to tune timeouts and polling intervals before increasing the number of HTTP pollers. Adding pollers increases concurrency, but it also increases memory usage and outbound network pressure.
Accepted HTTP Response Codes and Unsupported Items
By default, Zabbix expects HTTP responses to return status codes that are explicitly allowed for the item. If the response code does not match what is configured, the item becomes unsupported.
This behavior is often misunderstood. An unsupported item is not the same as a failed check. It indicates that Zabbix considers the response invalid for this item's definition.
Zabbix allows you to define accepted response codes in a flexible way. You can specify a single code, a comma-separated list of codes, or ranges of codes. This makes it possible to model real application behavior accurately.
For example, some APIs legitimately return 204 No Content on success, while others use 202 Accepted for asynchronous processing. If these codes are not listed as acceptable, Zabbix will mark the item unsupported even though the service is behaving correctly.
At an expert level, this mechanism is extremely useful. It allows you to distinguish between “the endpoint responded, but not in an acceptable way” and genuine transport-level failures such as timeouts or TLS errors.
Redirect Handling Limits
When redirect following is enabled, Zabbix will automatically follow HTTP redirects. However, this behavior is not unlimited.
Zabbix follows up to 10 HTTP redirects per request. If this limit is exceeded, the request fails. This protects the server from redirect loops and misconfigured endpoints.
In practice, production APIs and web services should never approach this limit. If they do, it usually indicates a configuration error that should be addressed rather than worked around.
For authenticated APIs, redirects should be used with caution. Authentication headers are not always resent across redirects, especially when hosts or protocols change. Monitoring the final endpoint directly is often the safer choice.
Enable Trapping: Pushing Data Instead of Pulling
HTTP agent items are typically used in a polling model, where Zabbix initiates the request. However, Zabbix also supports a hybrid approach through the “Enable trapping” option.
When trapping is enabled, the item can accept data pushed to it using zabbix_sender or the Zabbix API history.push method. This allows external systems or applications to send web content or processed results directly into Zabbix.
This is particularly useful in scenarios where the web application itself is capable of detecting important events and generating alerts. Instead of Zabbix repeatedly polling an endpoint, the application can push meaningful data when something noteworthy happens.
From an architectural standpoint, this turns the HTTP agent item into a flexible ingestion point rather than a pure polling mechanism. It is not a replacement for polling, but a powerful complement when event-driven monitoring makes more sense.
Practical Example: Monitoring the Zabbix API
The Zabbix API itself is a good example of HTTP agent usage because it is strict, well-defined, and widely deployed.
Authenticating to the API
The Zabbix API uses JSON-RPC over HTTP. Authentication is performed by calling the user.login method. Another better way is to use an API token and pass it in the Authorization header in the headers section.
The endpoint is typically:
The HTTP agent item is configured with a POST request and the following body:
The Content-Type header must be set to application/json. Without it, the API
will reject the request.
The response looks like this:
Using JSONPath preprocessing with $.result, the authentication token can be extracted.
Retrieving Data
The returned version string can be stored as a text item or evaluated by triggers. While this example is simple, the same pattern applies to retrieving problem counts, host statistics, or internal API data.
HTTP agent items are best suited for stateless, deterministic API calls. Token reuse and session orchestration are intentionally limited and should be handled externally if required.
Runtime Debugging and Logging
Debugging HTTP agent items does not require restarting the Zabbix server or proxy. Zabbix supports runtime log level control, including per-process adjustments.
HTTP agent items are executed by HTTP poller processes. To debug HTTP agent behavior specifically, logging should be increased only for those processes.
This is done using runtime control commands:
or on a proxy:
This approach allows detailed libcurl-level diagnostics without restarting services or flooding logs from unrelated processes.
When debug logging is enabled, the Zabbix log will show detailed information about DNS resolution, TLS negotiation, certificate validation, proxy usage, and timeout behavior. These messages are the authoritative source of truth when troubleshooting HTTP agent issues.
Always enable debugging on the node that actually executes the item. If a host is monitored via a proxy, increasing logging on the server will show nothing.
HTTP Agent Item Parameters Reference
The table below summarizes the key HTTP agent parameters and their purpose.
| Parameter | Description |
|---|---|
| URL | Full HTTP or HTTPS endpoint Zabbix will request. |
| Request method | HTTP method used for the request (GET, POST, PUT, PATCH, DELETE). |
| Request body | Optional payload sent verbatim with supported methods. |
| HTTP headers | Custom headers such as authentication tokens or content types. |
| Timeout | Maximum duration applied per blocking phase of the request lifecycle. |
| Follow redirects | Enables or disables automatic redirect handling. |
| HTTP authentication | Built-in HTTP authentication supported by libcurl. |
| Proxy | Optional HTTP proxy used for the request. |
| Retrieve mode | Determines whether body, headers, or status code is stored. |
| SSL verify peer | Enables or disables server certificate validation. |
| SSL verify host | Enables or disables hostname verification. |
| Client certificate | Client certificate for mutual TLS authentication. |
| Client key | Private key associated with the client certificate. |
| Preprocessing | Transforms responses into usable metrics. |
Conclusion
The HTTP agent item is one of the most powerful and misunderstood tools in Zabbix. It allows Zabbix to observe systems the same way applications and users do: through HTTP.
Used casually, it checks availability. Used deliberately, it becomes a precise, scalable, and secure API monitoring mechanism.
Understanding how it behaves internally — how timeouts are applied, how certificates are validated, and how logging really works — is what turns it from a feature into a tool.
Or, as every experienced API engineer eventually learns:
“HTTP is simple — until you assume it is.”
Questions
- Why does the HTTP agent item treat an HTTP 500 response differently from a timeout or TLS failure, and how should this influence trigger design?
- In what situations would using dependent items with a single HTTP agent item be preferable to creating multiple independent HTTP agent items?
- How does the asynchronous execution model of HTTP pollers change the way HTTP monitoring scales compared to traditional pollers?