Database checks via Zabbix agent 2
Now that we have covered database monitoring by ODBC, you might have some security questions. Because with ODBC, you will always have to open up your database for remote connections by our Zabbix server or proxy. For some environments, this might be out of the question. ODBC monitoring also requires additional tooling to be installed, which is something you will need to maintain.
The Zabbix agent 2 however, comes with built-in functionality to monitor some of the most popular SQL and no-SQL databases. - MariaDB - MySQL - PostgreSQL - Microsoft SQL - Oracle - Redis - MongoDB
The great part about using the Zabbix agent for monitoring your database is, you most likely already have the Zabbix agent installed on the Windows or Linux server running that database. Since the Zabbix agent is running on the local machine, the Zabbix agent can now be used to connect using localhost (127.0.0.1) to the database.
 4.x Zabbix ODBC vs Agent Database connection
Plugin installation
It's important to note that for Zabbix agent 2 to support database monitoring, you might have to install some additional plugin packages. This is the case specifically for:
- PostgreSQL
- Microsoft SQL
- MongoDB
To install the packages on Linux is not too much additional work, as we should already have the Zabbix repository available. Simply issues the following command to install the additional package(s) and you should be ready to go.
Install Zabbix agent 2 database monitoring plugins
RHEL-based:
``` dnf install zabbix-agent2-plugin-mongodb zabbix-agent2-plugin-mssql zabbix-agent2-plugin-postgresql
Debian based:

``` apt install zabbix-agent2-plugin-mongodb zabbix-agent2-plugin-mssql zabbix-agent2-plugin-postgresql
SUSE:
zypper in zabbix-agent2-plugin-mongodb zabbix-agent2-plugin-mssql zabbix-agent2-plugin-postgresql
On Windows we do have some additional steps, as we need to download an additional MSI. We can find the MSI at the following URL.
https://cdn.zabbix.com/zabbix/binaries/stable/
It's also possible to download the packages from https://www.zabbix.com/download_agents?. At this website simply select OS Distribution as Windows and at Encryption select No encryption. This will show you the Zabbix agent2 plugins vx.x.x MSI download link for your selected Windows version.
We are going to assume you have already installed the Zabbix agent 2 and the plugins on your server. If you do not know how, check out the previous part of this chapter titled Zabbix Agent installation and Passive monitoring and the steps above.
Setting up Microsoft SQL monitoring
Let's have a look at how to monitor a Microsoft SQL server using the Zabbix agent 2 database monitoring. Before we do this however, make sure to create a new user dedicated to monitoring in your Microsoft SQL server. This user will have limited permissions, to make sure that if the user becomes compromised, any attacker does not have a large vector of attack using the account.
Create zbx_monitor user
SQL server command:
CREATE LOGIN zbx_monitor WITH PASSWORD = 'change-the-password-here'
GRANT VIEW SERVER PERFORMANCE STATE TO zbx_monitor
GRANT VIEW ANY DEFINITION TO zbx_monitor
USE msdb
CREATE USER zbx_monitor FOR LOGIN zbx_monitor
GRANT EXECUTE ON msdb.dbo.agent_datetime TO zbx_monitor
GRANT SELECT ON msdb.dbo.sysjobactivity TO zbx_monitor
GRANT SELECT ON msdb.dbo.sysjobservers TO zbx_monitor
GRANT SELECT ON msdb.dbo.sysjobs TO zbx_monitor
GO
For the default setup with a Microsoft SQL server, things are fairly simple. First, we go to Data collection | Hosts and create a new host for our Windows server.
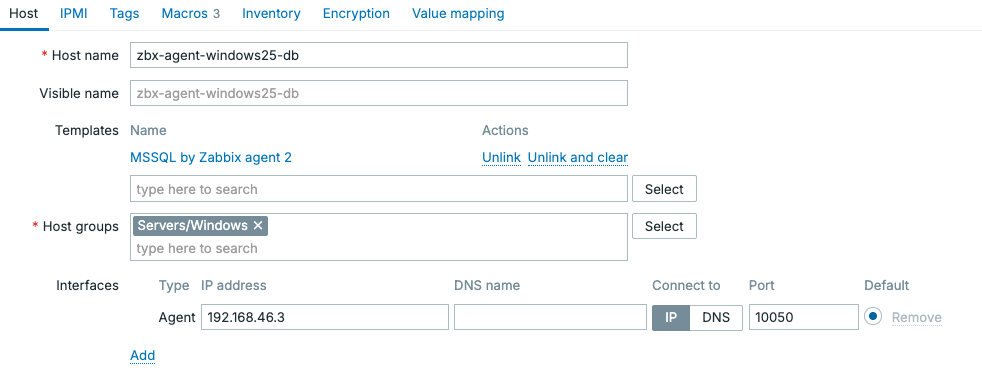
4.x Host creation - Windows server SQL
With the host created, it's important to note here we used the template MSSQL by Zabbix agent 2. This is a default template provided by Zabbix which will already include most of the important statistics you'd need monitoring a Microsoft SQL server. It's possible to monitor SQL servers using the Zabbix agent in both passive and active mode. If you'd like to use active mode just clone template MSSQL by Zabbix agent 2 to MSSQL by Zabbix agent 2 active and change all item types to Zabbix agent (active).
In the end it does not matter if you use a passive or active agent, as long as you have the agent connection setup we can do the next step. We need to configure our Zabbix agent to connect to the database server via the network. We do this using the macros on the host.
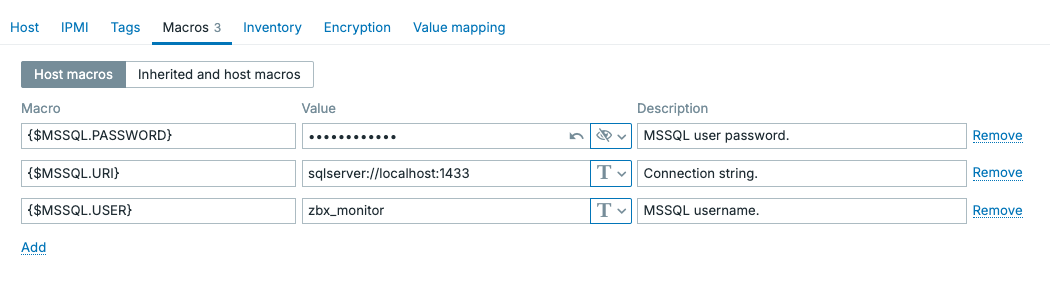
4.x Windows server SQL host macros
Since the agent is installed on the server running Microsoft SQL, we can simply connect to localhost or 127.0.0.1. That means the connection from the Zabbix agent towards the Microsoft SQL server never leaves the server itself and we do not need to expose our SQL server port to the network for our Zabbix server or proxy. Combined with Zabbix agent active mode, a limited Microsoft SQL user and agent encryption, we can guarantee a secure setup that is ready for high-risk environments like banks, hospitals, air traffic and even military applications. This is the biggest advantage of using the Zabbix agent 2 database monitoring, compared to ODBC.
Once we fill out the {$MSSQL.USER}, {$MSSQL.PASSWORD} and {$MSSQL.URI} macros, the Zabbix agent should be able to connect to our SQL server. Navigating to Monitoring | Latest data should now show us a bunch of data from the SQL server marking the successful configuration of our monitoring.
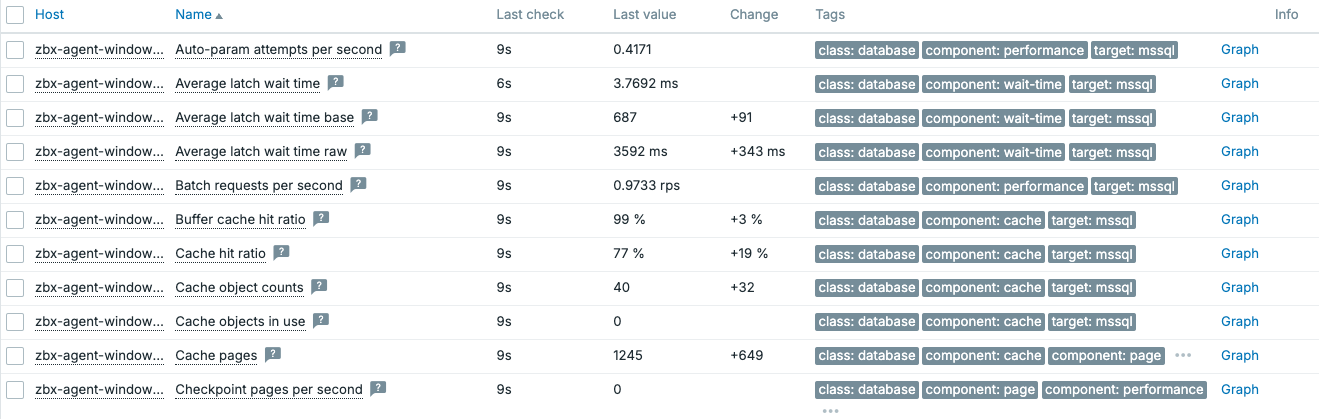
4.x Microsoft SQL server data
Note
Keep in mind that your Microsoft SQL server might be using a different port for connecting the the SQL server. Make sure to specify the correct port when setting up the {$MSSQL.URI} macro, you can find the port in the SQL server configuration.
Custom Microsoft SQL queries
Let's say the Zabbix template isn't going to fit every single thing you might want to monitor on your SQL server. How do you add some custom monitoring to the Zabbix agent 2 database monitoring? With ODBC we could simply add the query to the frontend and ODBC would execute it for us. For the Zabbix agent, there are some additional steps required.
First, let's make sure our agent configuration is setup correctly. Whenever we install the Zabbix agent 2 with any of the plugins, there will be additional configuration files located in the zabbix_agent2.d folder.
- Windows:
C:\Program Files\Zabbix Agent 2\zabbix_agent2.d\ - Linux:
/etc/zabbix/zabbix_agent2.d/
For our Microsoft SQL server running on Windows we are looking for the file C:\Program Files\Zabbix Agent 2\zabbix_agent2.d\mssql.conf. Open the file and edit the following two lines.
mssql.conf plugin configuration file edit
### Option: Plugins.MSSQL.CustomQueriesDir
#   Filepath to a directory containing user defined .sql files with custom
#   queries that the plugin can execute.
#   If not set the default path will take the drive name from `ProgramFiles` environment.
#   Replace "*" with the hard drive name.
#
# Mandatory: no
# Default:
# Plugins.MSSQL.CustomQueriesDir=*:\Program Files\Zabbix Agent 2\Custom Queries\MSSQL

Plugins.MSSQL.CustomQueriesDir=C:\Program Files\Zabbix Agent 2\Custom Queries\MSSQL

### Option: Plugins.MSSQL.CustomQueriesEnabled
#   If set enables the execution of the `mssql.custom.query`item key and the plugin will
#   search for custom query files in directory specified by
#   Plugins.MSSQL.CustomQueriesDir config option.
#
# Mandatory: no
# Default:
# Plugins.MSSQL.CustomQueriesEnabled=false

Plugins.MSSQL.CustomQueriesEnabled=true
We set the folder to C:\Program Files\Zabbix Agent 2\Custom Queries\MSSQL and that's where we will place our new SQL files. Make sure to create the folder in that path and let's create the following file in the new folder.
mssql.conf plugin configuration file edit
C:\Program Files\Zabbix Agent 2\Custom Queries\MSSQL\sleeping_sessions.sql
With the edits made and the folders and file created, we can restart the Zabbix agent 2 service and navigate to the Zabbix frontend. Here we will create a new item to monitor this sleeping sessions query we created. Navigate to Data collection | Hosts and go to Items. Then click on Create item. Preferably you would add the item to a template, but for now let's create it here.
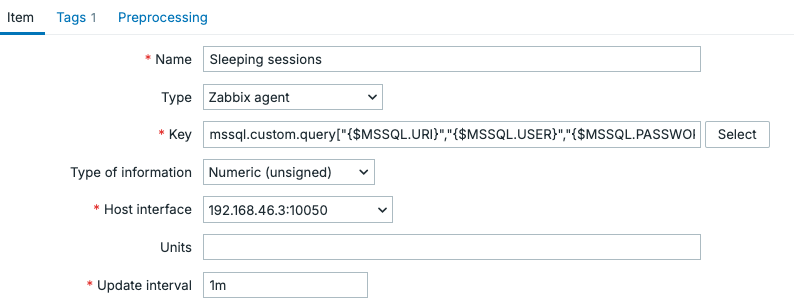
4.x Microsoft SQL server custom query
The full key is mssql.custom.query["{$MSSQL.URI}","{$MSSQL.USER}","{$MSSQL.PASSWORD}",sleeping-sessions]
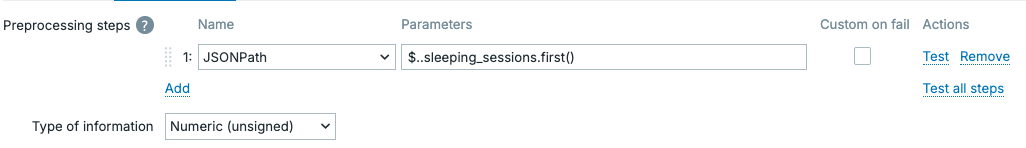
Make sure to add some preprocessing with the type JSONPath using the Parameter: $..sleeping_sessions.first().
4.x Microsoft SQL server custom query preprocessing
Don't forget to add a tag to the item.
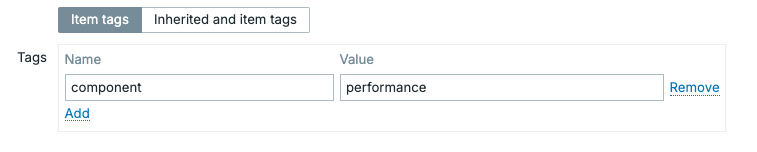
4.x Microsoft SQL server custom query tag
This item should now return a nice numeric value which you can see at Monitoring | Latest data.
Setting up Redis and MongoDB monitoring
Conclusion
Monitoring databases through the Zabbix agent 2 provides a secure and efficient alternative to traditional ODBC based monitoring. Because the agent runs locally on the database server, it can connect directly to the database using localhost or 127.0.0.1. This eliminates the need to expose database ports to the network for the Zabbix server or proxy, significantly reducing the attack surface.
With the built-in database plugins and official templates, most common monitoring metrics are available immediately after configuration. This allows us to quickly gain insight into the health and performance of their database systems without relying on external scripts or additional monitoring frameworks.
For environments with specific monitoring requirements, the agent also supports custom SQL queries. By enabling the custom query functionality and placing .sql files in the configured directory, we can easily extend the default monitoring capabilities. These custom checks can then be integrated into Zabbix items and processed using preprocessing steps to extract the desired values.