Frontend uitgelegd
Dit hoofdstuk gaat over de basis die we moeten weten als het gaat om de Zabbix gebruikersinterface en de dingen die we moeten weten voordat we volledig in onze monitoring tool kunnen duiken. We zullen zien hoe de gebruikersinterface werkt, hoe we een host, groepen gebruikers, items kunnen toevoegen ... zodat we een goed begrip hebben van de basis. Dit is iets dat soms gemist wordt en tot frustraties kan leiden als we niet weten waarom dingen niet werken zoals we verwacht hadden dat ze zouden werken. Dus zelfs als je een gevorderde gebruiker bent, kan het nuttig zijn om even naar dit hoofdstuk te kijken.
Aan de slag
Overzicht van de interface
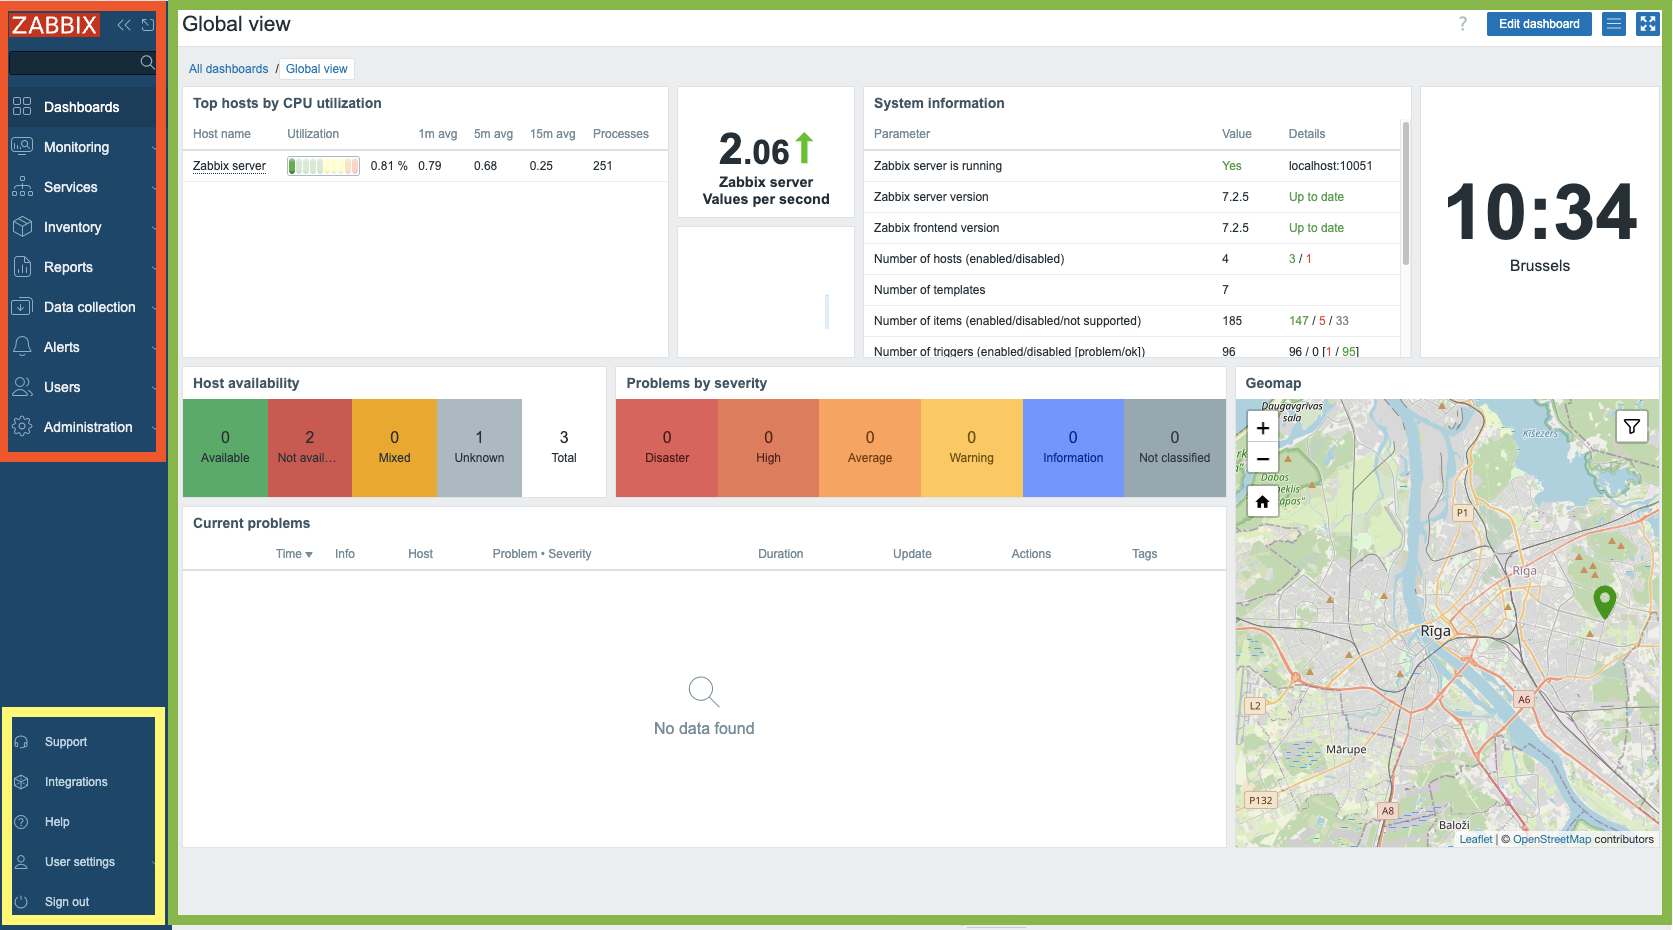
Met Zabbix 7 is de gebruikersinterface na het inloggen een beetje veranderd. Ons menu aan de linkerkant van het scherm heeft een kleine opknapbeurt gekregen. Laten we er eens in duiken. Als we de eerste keer inloggen in onze Zabbix setup met onze Admin-gebruiker zien we een pagina
like this where we have our main window in green
our main menu marked in red and our links marked in
yellow.
2.1 Overview
The main menu can be hidden by collapsing it completely or to reduce it to a set of small icons. When we click on the button with the 2 arrows to the left:

2.2 Collapse
You will see that the menu collapses to a set of small icons. Pressing ">>" will
bring the main menu back to it's original state.
When you click on the icon that looks like a box with an arrow sticking out,
next to the "<<" button will hide the main menu completely.

2.3 Hide
To bring back our main menu is rather easy, we just look for the button on the
left with three horizontal lines and click on it. This will show the main menu
but it won't stay. When we click on the box with the arrow now pointing to the
bottom right it will keep the main menu back in it's position.
Yet another way to make the screen bigger that is quite useful for monitors in
NOK teams for example is the kiosk mode button. This one however is located
on the left side of your screen and looks like 4 arrows pointing to every corner
of the screen. Pressing this button will remove all the menus and leave only the
main window to focus on.

2.4 Expand
When we want to leave the kiosk mode, the button will be changed to 2 arrows pointing to the inside of the screen. Pressing this button will revert us back to the original state.

2.5 Shrink
Tip
We can also enter and exit kiosk mode by making use of parameters in our Zabbix
url: /zabbix.php?action=dashboard.view&kiosk=1 - activate kiosk mode or
/zabbix.php?action=dashboard.view&kiosk=0 - activate normal mode.
Note
There are many other page parameters we can use. A full list can be found at https://www.zabbix.com/documentation/7.4/en/manual/web_interface/page_parameters Zabbix also has a global search menu that we can use to find hosts, host groups and templates.
If we type in the search box the word server you will see that we get an
overview of all templates, host groups and hosts with the name server in
it. That's why this is called the global search box.
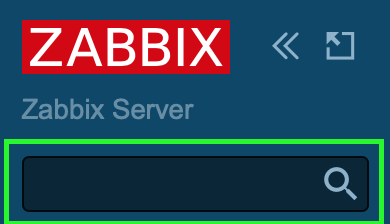
2.6 Global search
This is our result after we looked for the word server. If you have a standard
Zabbix setup your page should look more or less the same.

2.7 Global search result
Main menu
We shall now briefly examine the constituent sections of the primary application
menu. The main menu, situated on the left hand interface, comprises a total of
nine distinct sections:
| Menu Name | Details |
|---|---|
| Dashboards | Contains an overview of all the dashboards we have access to. |
| Monitoring | Shows us the hosts, problems, latest data, maps, ... |
| Services | An overview of all the Services and SLA settings. |
| Inventory | An overview of our collected inventory data. |
| Reports | Shows us the system information, scheduled reports, audit logs, action logs, etc . |
| Data collection | Contains all things related to collecting data like hosts, templates, maintenance, discovery, ... |
| Alert | The configuration of our media types, scripts and actions |
| Users | User configuration like user roles, user groups, authentication, API tokes, ... |
| Administration | The administration part containing all global settings, housekeeper, proxies, queue, ... |
Links menu
Immediately subjacent to the primary application menu on the left-hand interface
resides the Links menu. This module furnishes a collection of pertinent
hyperlinks for user access.
| Menu name | Details |
|---|---|
| Support | This brings us to the technical support page that you can buy from Zabbix. Remember that your local partner is also able to sell these contracts and can help you in your own language. Your local distributors |
| Integrations | The official zabbix integration page |
| Help | The link to the documentation of your Zabbix version |
| User settings | The user profile settings. |
| Sign out | Log out of the current session. |
A few interactive elements remains to be addressed on the right-hand portion of the display.

2.8 Edit dashboard
The Edit dashboard button facilitates modification of the user's dashboard
configuration, a feature that will be elaborated upon in subsequent sections.
Located on the extreme left margin is a query mark icon ('?'), activation of
which redirects the user to the Zabbix documentation portal providing
comprehensive details regarding dashboard functionalities. Conversely, the
control situated on the right margin, represented by three horizontal lines,
provides access to operations such as sharing, renaming, and deletion of user
defined dashboards.
System information
The dashboard also features a dedicated panel labeled System Information. This
widget provides a real-time overview of the operational status of the Zabbix
deployment. We will now examine the individual data points presented within this
panel, as their interpretation is crucial for system comprehension.
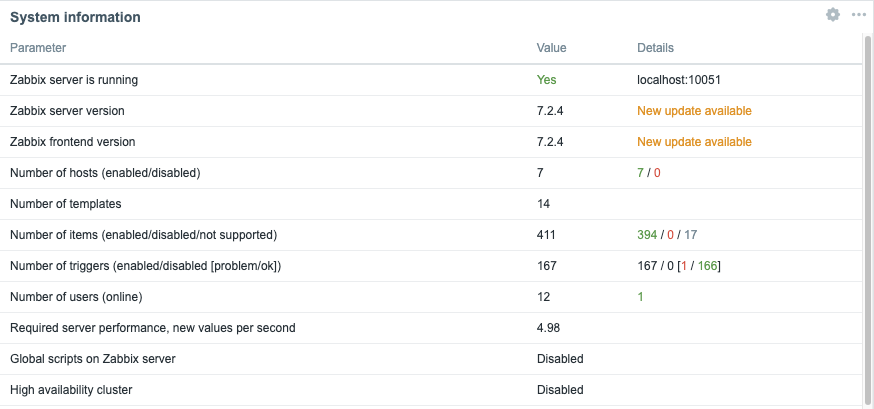
2.9 System Information
| Parameter | Value | Details |
|---|---|---|
| Zabbix server is running | The status of our zabbix server if it is running yes or no and if it is running on our localhost or another IP and on what port the zabbix server is listening. If no trapper is listening the rest of the information can not be displayed | IP and port of the Zabbix server |
| Zabbix server version | This shows us the version of the Zabbix server so the version you see at the bottom of your screen is the one from the Zabbix frontend and can be different but should be in the same major version. |
Version Number |
| Zabbix frontend version | This is the version of the frontend and should match with what you see at the bottom of your screen. | Version Number |
| Number of hosts (enabled/disabled) | The total number of hosts configured on our system | How many of those are enabled and disabled |
| Number of templates | The number of templates installed on our Zabbix server. | |
| Number of items (enabled/disabled/not supported) | This line shows us the number of items we have configured in total in this case 99 | 90 are enabled and 0 are disabled but 9 of them are unsupported. This last number is important as those are items not working. We will look into this later why it happens and how to fix it. For now remember that a high number of unsupported items is not a good idea. |
| Number of triggers (Enabled/disabled[problem/ok]) | The number of triggers configured | Number of enabled and disabled triggers. Just as with items we also see if there are triggers that are in a problem state or ok state. A trigger in a problem state is a non working trigger something we need to monitor and fix. We will cover this also later. |
| Number of users (online) | Here we see the number of users that are configured on our system | The number of users currently online. |
| Required server performance, nvps | The number of new values per second that Zabbix will process per second. | This is just an estimated number as some values we get are unknown so the real value is probably higher. So we can have some indication about how many IOPS we need and how busy our database is. A better indication is probably the internal item zabbix[wcache,values,all] |
| Global scripts on Zabbix server | It notifies us that the Global scripts are enabled or disabled in the server config. | Global scripts can be used in our frontend, actions, ... but need to be activated first |
| High availability cluster | It will show us if Zabbix HA cluster is disabled or not | Failover delay once HA is activated |
Enabling Global script execution
Global script execution on Zabbix server can be enabled by setting
EnableGlobalScripts=1 in the Zabbix server configuration at /etc/zabbix/zabbix_server.d/.
For new installations, since Zabbix 7.0, global script execution is
disabled by default.
Tip
System information may display some additional warnings like:
- when your database doesn't have the correct character set or collation UTF-8.
- when the database you used is lower or higher then the recommended version or
- when there are misconfigurations on housekeeper or TimescaleDB.
Another warning you can see is about database history tables that aren't upgraded or primary keys that have not been set. This is possible if you are coming from an older version before Zabbix 6 and never did the upgrade.
The main menu explained
It's important to know that we have seen so far our dashboard with the Admin
user and that this user is a Zabbix Super Admin user. This has a serious
impact on what we can see and do in Zabbix as this user has no restrictions.
Zabbix works with 3 different levels of users we have the regular users,
Zabbix Admin and Zabbix Super Admin users. Let's have a deeper look at the
differences :
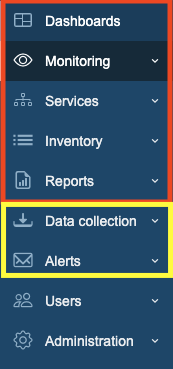
2.10 Main menu sections
- A
Zabbix Userwill only see the red part of ourmain menuand will only be able to see our collected data. - A
Zabbix Adminwill see the red part and the yellow part of themain menuand is able to change our configuration. - A
Zabbix Super Adminwill see the completemain menuand so is able to change the configuration and all the global settings.
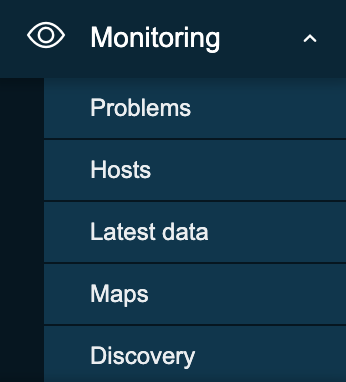
2.11 Monitoring menu
- Problems: This page will give us an overview of all the problems. With filter we can look at recent problems past problems and problems that are active now. There are many more filters tor drill down more.
- Hosts: This will give us a quick overview page with what's happening on our hosts and allows us to quickly go to the latest data, graphs and dashboards.
- Latest data: This page I probably use the most, it shows us all the information collected from all our hosts.
- Maps: The location where we can create map that are an overview of our IT infrastructure very useful to get a high level overview of the network.
- Discovery: When we run a network discovery this is the place where we can find the results.
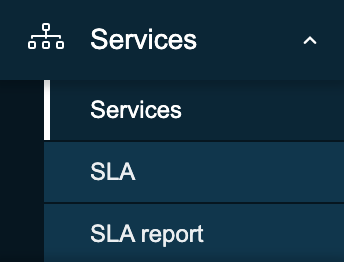
2.12 Services menu
- Services: This page will give us a high level overview of all services configured in Zabbix.
- SLA: An overview of all the SLAs configured in Zabbix.
- SLA Report: Here we can watch all SLA reports based on our filters.
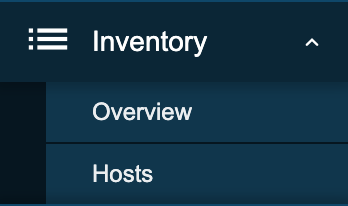
2.13 Inventory menu
- Overview: A place where we can watch all our inventory data that we have retrieved from our hosts.
- Hosts: Here we can filter by host and watch all inventory data for the hosts we have selected.
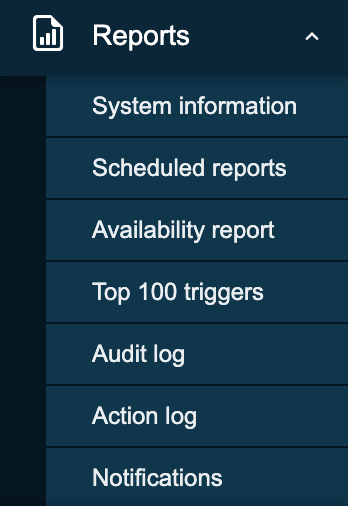
2.14 Inventory menu
- System information: System information is a summary of key Zabbix server and system data.
- Scheduled reports: The place where we can schedule our reports, a
pdfof the dashboard that will be sent at a specified time and date. - Availability report: A nice overview where we can see what trigger has
been in
ok/nokstate for how much % of the time - Top 100 triggers: Another page I visit a lot here we have our top list
with triggers that have been in a
NOKstate. - Audit log: An overview of the user activity that happened on our system. Useful if we want to know who did what and when.
- Action log: A detailed overview of our actions can be found here. What mail was sent to who and when ...?
- Notifications: A quick overview of the number of notifications sent to each user.
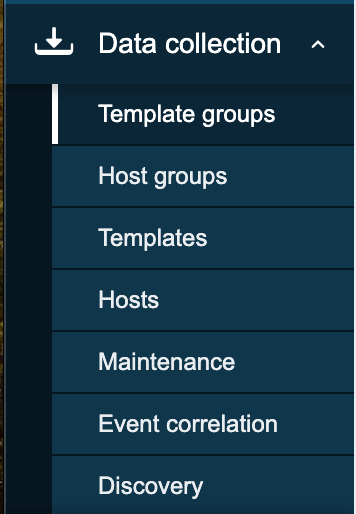
2.15 Data collection
- Template groups: A place to logical group all templates together in different groups. Before it was mixed together with hosts in host groups.
- Host groups: A logical collection of different hosts put together. Host groups are used for our permissions.
- Templates: A set off entities like items and triggers can be grouped together on a template, A template can be applied to one or more hosts.
- Hosts: What we need in Zabbix to monitor A host, application, service ...
- Maintenance: The place to configure our maintenance windows. A maintenance can be planned in this location.
- Event correlation: When we have multiple events that fires triggers related we can configure correlations in this place.
- Discovery: Sometimes we like to use Zabbix to discover devices, services,... on our network. This can be done here.
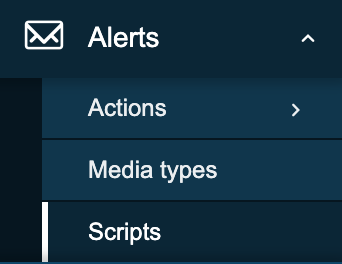
2.16 Alerts menu
- Actions: This menu allows us to configure actions based on
eventsin Zabbix. We can create such actions for triggers, services, discovery, autoregistration and internal events. - Media types: Zabbix can sent messages, emails etc ... based on the actions we have configured. Those media types need templates and need to be activated.
- Scripts: In Zabbix it's possible to make use of scripts in our actions and frontend. Those actions need to be created here first and configured.
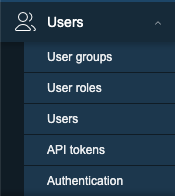
2.17 Users menu
- User groups: The
User groupsmenu section enables the creation and management of user groupings for streamlined access and permission control. - User roles: The
User rolesmenu section defines sets of permissions that can be assigned to individual users, limiting their allowed actions based on the user type they have within the system. - Users: The
Usersmenu section provides the interface for managing individual user accounts, including creation and modification settings. - API tokens: The
API tokensmenu section manages authentication credentials specifically designed for programmatic access to the system's Application Programming Interface (API), enabling secure automation and integration with external applications. - Authentication: The
Authenticationmenu section configures the methods and settings used to verify user identities and control access to the system.
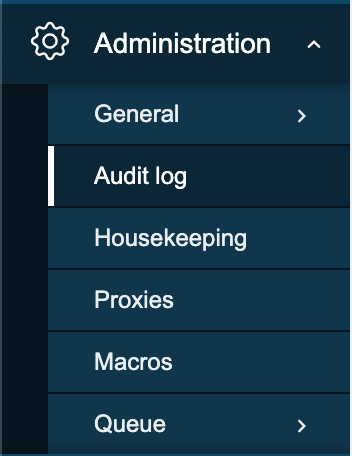
2.18 Administration menu
- General: The
Generalmenu section within administration allows configuration of core system-wide settings and parameters. - Audit log: The
Audit logmenu section provides a chronological record of system activities and user actions for security monitoring and troubleshooting. - Housekeeping: The
Housekeepingmenu section configures automated maintenance tasks for managing historical data and system performance. - Proxies: The
Proxiesmenu section manages the configuration and monitoring of proxy servers used for communication with managed hosts in distributed environments. - Macros: The
Macrosmenu section allows the definition and management of global variables for flexible system configuration. - Queue: The
Queuemenu section provides real-time insight into the processing status of internal system tasks and data handling.
Info
More information can be found in the online Zabbix documentation here
Tip
You will see that Zabbix is using modal forms in the frontend on many places.
The problem is that they are not movable. This
module created by one of the Zabbix developers UI Twix will solve this problem
for you.
Warning
At time of writing there is no Dashboard import/export functionality in zabbix. So when upgrading dashboards it needs to be created by hand. It was on the roadmap for 7 but didn't made it so feel free to vote https://support.zabbix.com/browse/ZBXNEXT-5419
Conclusie
The Zabbix frontend serves as the central command center for monitoring, configuration, and system awareness. In this chapter, you explored how to navigate its interface from dashboards and the customizable main menu to powerful tools like system information and global search. You learned how each menu section (Monitoring, Data Collection, Alerts, Users, Administration, and more) aligns with distinct functions, and how kiosk mode and layout controls help optimize visibility during daily operations.
Additionally, the system information widget stands out as a real time diagnostic snapshot, revealing critical metrics such as server status, number of hosts, templates, items, triggers, and user activity all of which aid rapid troubleshooting and performance assessment.
By mastering these frontend components, you're now better equipped to confidently navigate Zabbix, manage user access, interpret monitoring data, and maintain your environment more effectively. This foundational knowledge lays the groundwork for deeper exploration into host configuration, authentication mechanisms, and advanced monitoring workflows in the chapters that follow.
Vragen
-
Which frontend section (Monitoring, Data Collection, Alerts, Users, or Administration) do you think you'll use most often in your daily work, and why?
-
How can kiosk mode be useful in a real-world monitoring environment, and what types of dashboards would you display with it?
-
What insights can the system information widget provide during troubleshooting, and how might it help identify issues with server performance?
-
Why is it important to understand the difference between data displayed in “Monitoring” and configuration options found in “Data Collection”?
-
If you were onboarding a new team member, which parts of the frontend would you show them first, and why?
Nuttige URL's
- https://www.zabbix.com/documentation/current/en/manual/web_interface/frontend_sections/dashboards
- https://blog.zabbix.com/handy-tips-6-organize-your-dashboards-and-create-slideshows-with-dashboard-pages/17511/
- https://blog.zabbix.com/interactive-dashboard-creation-for-large-organizations-and-msps/30132/