Simple checks
What would a Zabbix book be without setting up the actual monitoring itself, because in the end a monitoring system is all about collecting data through various different protocols.
Simple checks are one (or actually several) of such protocols. Zabbix has a bunch of built-in
checks we can do, executed from the Zabbix server or proxy towards our monitoring targets. The simple
checks contain protocol checks such as ICMP Ping, TCP/UDP but also built in VMware monitoring.
Without further ado, let's set up our first items. Please keep in mind that we will be building everyhting on a host level for now. Check out Chapter 06 to learn how to do this properly on a template.
Building the item
We shall start with a simple ICMP Ping check. If you haven't already, at Data collection | Hosts
let's create the host simple-checks in the host group Servers/Linux. Then, for this
new host navigate to Items. You should see a Create item button in the top right corner. Click
on this button and lets have a look at the item creation modal popup window:
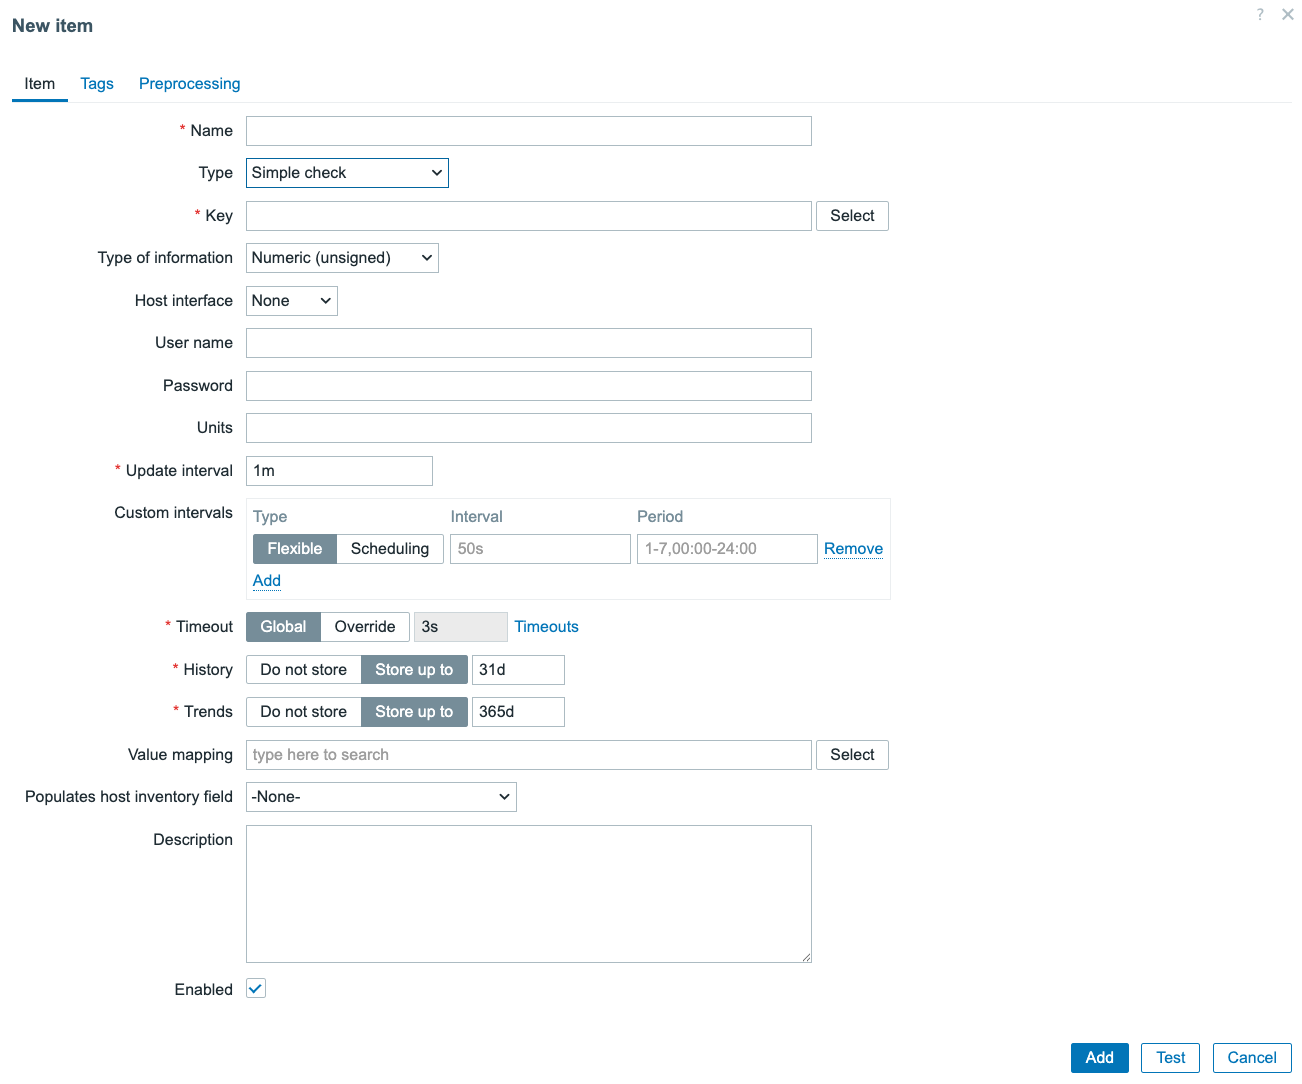
4.5 Empty Item creation window
Make sure to change the Type to Simple check to get a similar result. We can see there are
only two fields (that aren't selectors) mandatory. These, we have to fill in to make our
item work.
- Name
- Key
Item Name
The Item name in Zabbix is a very important field for all of our items. This is going
to be the first thing you see when looking for you configuration, but also the main identifier
when you'll search the visualisation pages (like Latest data) for this item.
Item names do not have to be unique (although it is recommended), as it will be
the Item key that will make sure this item is distinguishable as a unique entity. So what is
the best practise here?
- Item names should be short and descriptive
- Item names should contain prefixes where useful
- Item names should contain suffixes where useful
Some examples of good item names:
- Use Memory utilization not The memory util of this host. Keep it short and descriptive
- Use CPU load or if you have multiple use a suffix CPU load 1m and
CPU load 5m for example
- Use prefixes like Interface eth0: Bits incoming and
Interface eth1: Bits incoming for similar items on different entities
Using those techniques, we can create items that are easy to find and most importantly that your Zabbix users will want to read. After all, you can count on IT engineers to not read well, especially in a troubleshooting while everything is down scenario. Keeping things simple will also make sure your monitoring system will be a pleasure to be used or at least people won't avoid using your monitoring.
My final and favourite tip is: Remember: Zabbix uses alphabetical sorting in a lot of places. Why
is this important, well let's look at the Monitoring | Latest data page with a host using a
default template:
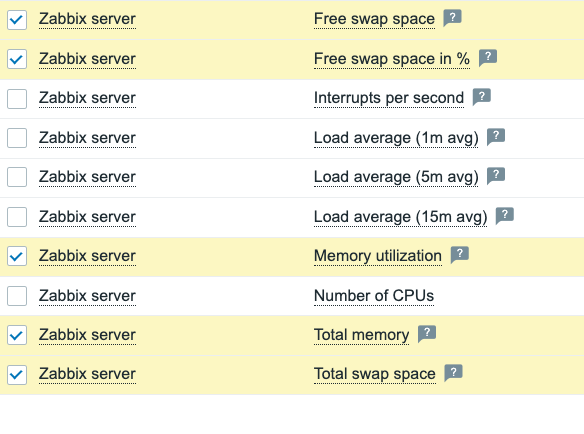 4.5 Latest data Memory and CPU items sorting
If this template had used CPU and Memory as a prefix for all respective items. Then this page would have nicely sorted them together. While right now, there are CPU items right between the memory related items. It creates a bit of a mess, making Zabbix harder to read.
If you want to spend (waste?) 30 minutes of your time hearing all about sorting data in various different places in Zabbix. The following video is highly recommended: https://www.youtube.com/watch?v=5etxbNPrygU
Item Key
Next up is the item key, an important part of setting up your Zabbix item as it will serve as the uniqueness criteria for the creation of this entity. There are two types of item keys:
- Built in
- User defined
The built in item keys is what we will use to create our simple check in a while. The user defined
item key is what we will use on items types like SNMP and Script. The main difference is that
built in item keys are defined by Zabbix and attach to a specific monitoring function. The user defined
item keys are just there to serve as the uniqueness criteria, while a different field in the item form
will determine the monitoring function.
Item keys can also be of a Flexible or Non-flexible kind. Flexible meaning the item key accepts
parameters. These parameters change the function of the built-in item keys and also count as part
of the uniqueness of the item keys. For example:
- agent.version a
Zabbix agentitem key doesn't accept parameters and only serves one purpose. To get the version of the Zabbix agent installed. - net.tcp.service[service,
, a] Simple checkitem key that accepts 3 parameters, each parameter diveded by a comma(,). Optional parameters are marked by the<>signs, whereas mandatory parameters have no pre/suffix.
ICMP Ping
With all of this in mind, let's finish the creation our ICMP Ping item. First, we will give our new item a name. Since this is a simple ICMP Ping to the host lets go for:
- Name =
ICMP Ping
For the key, we will have to use the built-in key
icmpping[<target>,<packets>,<interval>,<size>,<timeout>,<options>]. This key accepts 6 parameters, all
of which are optional. However, when we do not select an interface on an icmpping item, we
need to fill in at least icmpping[<target>] for it to work. Normally imcpping can use the interface
IP or DNS, but since we will discuss the Host interfaces later in this chapter, let's use
the parameter instead.
- Key =
icmpping[127.0.0.1]
The item will now look like this:
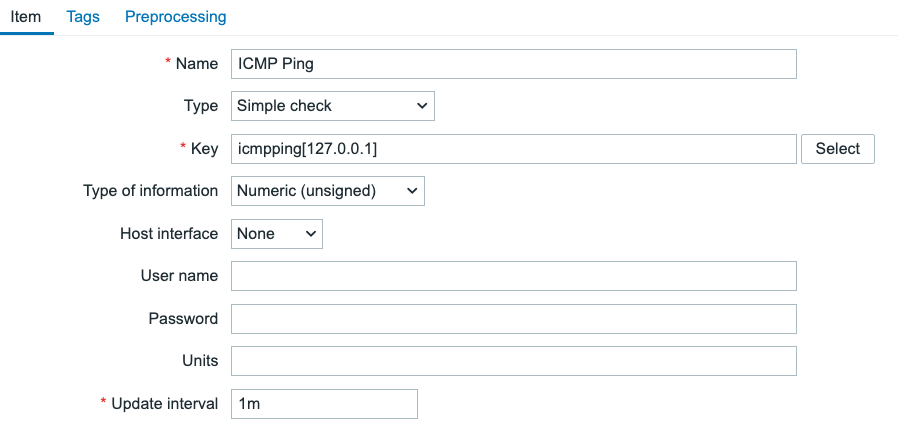 4.7 ICMP Ping item
It's also best practise to add a tag with the name component to every item we create. Let's switch
to the Tags tab on the item creation window, and create the tag component:system.
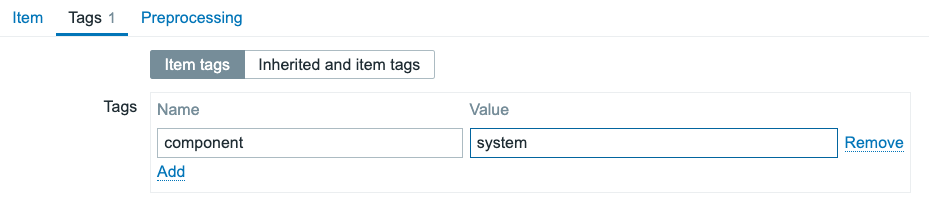 4.8 ICMP Ping item tags
Zabbix utilises the fping utility, installed on the Zabbix server and/or proxy, to execute ICMP Ping checks. By default, Zabbix adds a repository containing the tool and installs the dependency. If you have a slightly different setup, make sure this utility is installed on your system and that the following two parameters are configured in the Zabbix server/proxy configuration file:
create mariadb repository
``` FpingLocation=/usr/sbin/fping
Fping6Location=/usr/sbin/fping6 ```
TCP/UDP Ports
Another useful simple check you can create is the TCP (and UDP) port check. With these 4 item keys we can monitor the availability and performance of TCP and UDP ports. There are 4 built-in keys available for these checks:
- net.tcp.service[service,
, ] - net.tcp.service.perf[service,
, ] - net.udp.service[service,
, ] - net.udp.service.perf[service,
, ]
Granted, the net.udp.service item keys only monitor the availability and performance of the NTP
protocol due to the "take it our leave it" nature of UDP. But, the net.tcp.service item keys are
useful for monitoring every single TCP port available.
We fill in the service parameter with tcp and the we use ip (or a host interface) and port
to define which TCP port to check. Zabbix will connect to the port and tell us the up/down status
or the connection speed if we use net.tcp.service.perf. If we fill in the service parameter with
ssh, ldap, smtp, ftp, pop, nntp, imap, tcp, https, telnet it will use the correct (default) port
automatically, as well as do an additional check to make sure the port is actually being used by that service.